


The Paired Sample t-test (also called Dependent Sample t-test) is a statistical tool that helps you compare two related sets of data — usually “before and after” situations. It tells you whether the difference between two time points, two conditions, or two related groups is statistically significant or just due to chance. The Paired Sample t-test is considered a univariate test because it analyzes one dependent variable with continuous data — the difference between two related measurements.
Let’s break it down step-by-step with easy examples from different domains of the study.
What is a Paired Sample t-Test?
It is used when you collect data from the same subjects at two different times (periods) or under two different conditions.
It’s like asking: “Did something change significantly after the treatment, training, or event?”
When to Use It?
Use a Paired Sample t-test if:
- You are comparing two scores from the same group.
- Your data is continuous (like test scores, weight, time, etc.).
- Your samples are related or dependent.
- Your data is approximately normally distributed.
Application of Paired Sample t-test in different fields
1. Education
Research Question: Did students improve after attending an online Maths course?
- Before: Collect math test scores of the students before attending the course.
- After: Collect scores of the students after attending the course.
Use Paired t-test to compare the “before” and “after” scores of the same students.
2. Medicine / Health Sciences
Research Question: Does a new diet plan reduce blood pressure of the patients?
- Before: Measure blood pressure before starting the diet.
- After: Measure after 6 weeks.
Use the test to check if the change in BP is significant for the same patients.
3. Marketing
Research Question: Did customer satisfaction improve after a new service policy?
- Collect satisfaction ratings from customers before and after implementing the policy.
- Apply the Paired t-test to see if the new policy made a real difference in ratings.
4. Psychology
Research Question: Does meditation reduce stress levels?
- Measure participants’ stress scores before and after 2 weeks of meditation.
- Run the Paired t-test to compare the two scores for each individual.
Step-by-Step: Applying the Paired Sample t-Test
Step 1: Define Your Research Question
Ask a question where the same group is measured twice.
Examples:
Do students perform better after using an e-learning app?
Does a 4-week yoga program reduce anxiety levels in patients?
Did customer satisfaction improve after launching a chatbot service?
Do employees perform better after implementing training program?
Step 2: Collect Paired Data
Collect before and after data (scores) for the same participants.
Make sure both sets are continuous data (like test scores, marks, ratings, measurements, etc.).
Step 3: Check Assumptions
Data should be paired (from the same subjects).
No. of participants are same in both the cases and also the same participants (before and after)
The differences between pairs should be approximately normally distributed.
Step 4: Run the Paired Sample t-Test
- Calculate the difference between each pair (After – Before).
- Find the average of these differences (mean difference).
- Calculate the standard deviation of the differences.
- Find the ‘t test value
You can use tools like Excel, SPSS, R, or Python to run the test.
Step 5: Interpret the Output/Results
You will get:
t-value: How large the difference is in standardized terms.
p-value: Probability the difference occurred by chance.
If p-value < 0.05 → There is a significant difference.
If p-value ≥ 0.05 → No statistically significant change (likely due to chance).
Step 6: Report the Result
Example:
The paired sample t-test showed a significant improvement in performance scores after the training program (t(29) = 2.91, p = 0.006).
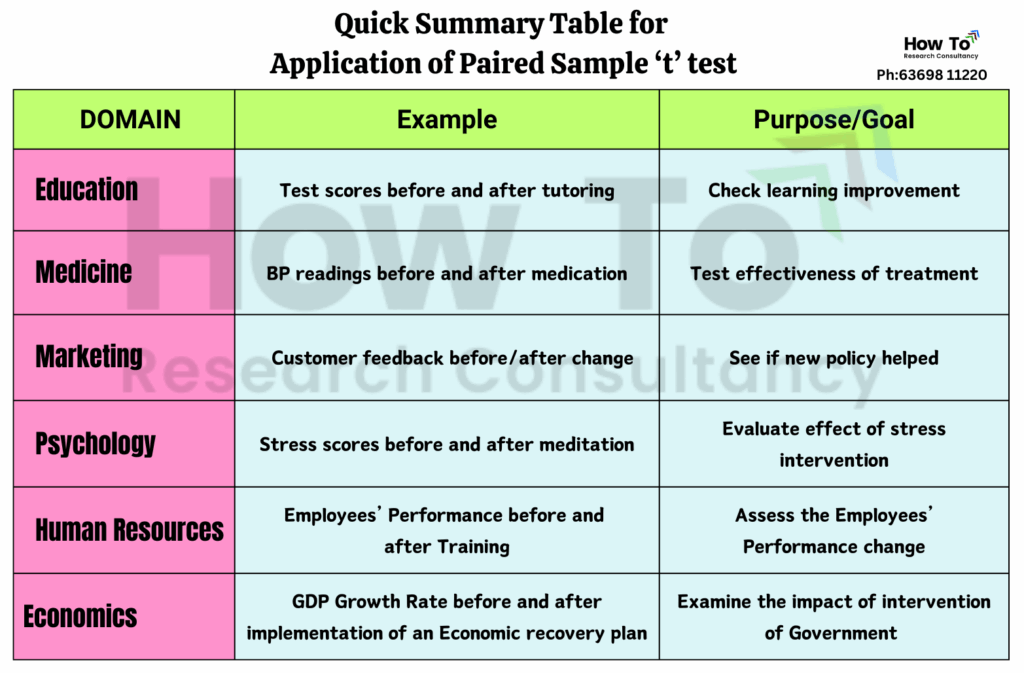
The following table present the Summary of Application of Paired Sample ‘t’ test:
Conclusion
The Paired Sample t-test is a simple but powerful tool when you’re working with two related datasets. It helps you check whether an intervention, treatment, or condition actually made a measurable difference.
Key Tip: Always make sure your data is paired and normally distributed before using this test.
Need help applying the Paired Sample t-test or interpreting the results for your research?
Feel free to reach out…


Leave a Reply