


Introduction
Sampling is the process of selecting a subset of individuals or elements from a larger population to represent the entire group in a research study, making data collection more practical in terms of time, cost, and feasibility. A well-chosen sample ensures that the results are generalizable and statistically valid. The sample size refers to the number of individuals or units selected for the study, which depends on factors such as confidence level, margin of error, population variability, and statistical methods used.
Determining the appropriate sample size is a crucial aspect of research, as it directly impacts the reliability and validity of the study findings (Cochran, 1977). An inadequate sample size may lead to incorrect conclusions, while an excessively large sample can be costly and time-consuming (Creswell, 2018). This blog explores the importance of sample size determination, key statistical methods, and a live example illustrating its application.
Importance of Sample Size Determination
A well-calculated sample size ensures that the study results are generalizable to the target population (Slovin, 1960). The primary goals of sample size determination include:
- Reducing Sampling Error: A larger sample generally reduces variability and improves precision (Field, 2013).
- Enhancing Statistical Power: Adequate sample size increases the probability of detecting a true effect (Cochran, 1977).
- Optimizing Resources: It helps balance the need for accuracy with time and budget constraints (Creswell, 2018).
Key Factors Influencing Sample Size
Several factors determine the appropriate sample size for a study (Krejcie & Morgan, 1970):
- Population Size (N): The total number of individuals in the target population.
- Margin of Error (E): The allowable deviation from the true population parameter.
- Confidence Level: Typically set at 90%, 95%, or 99%, indicating the probability that the sample accurately reflects the population.
- Standard Deviation (σ): The measure of variability within the population.
- Effect Size: The magnitude of difference or relationship the study aims to detect.
Common Methods for Sample Size Calculation
1. Cochran’s Formula (Cochran, 1977):
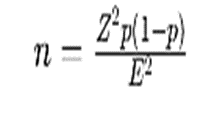
Z = Z-score (e.g., 1.96 for 95% confidence level)
p = Estimated proportion (assumed 0.5 if unknown)
E = Margin of error (expressed as a decimal, e.g., 0.05 for 5%)
n = Required Sample Size
2. Yamane (1967) and Slovin’s Formula (Slovin, 1960):
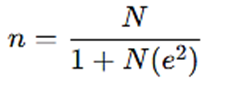
N = Population size
e = Desired margin of error (expressed as a decimal, e.g., 0.05 for 5%)
n = Required Sample Size
Both Slovin (1960) and Yamane (1967) derived the same formula for determining sample size. Taro Yamane’s work in 1967 popularized the formula in research methods books, but the same formula was attributed earlier to Slovin (1960). In practice, researchers refer to either name interchangeably when using this formula.
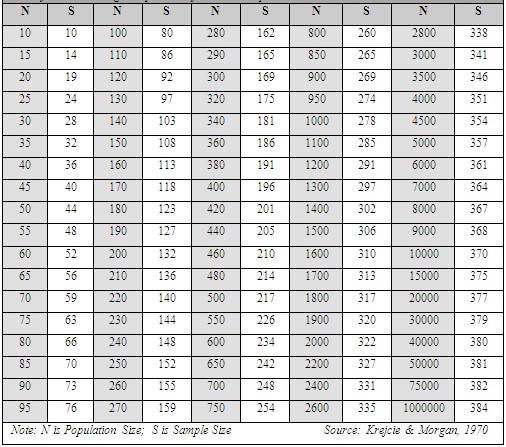
3. Krejcie and Morgan’s Table (Krejcie & Morgan, 1970):
Krejcie and Morgan developed a widely used sample size table for finite populations. This table provides pre-calculated sample sizes based on different population sizes and confidence levels, eliminating the need for complex formulas. For example, for a population of 10,000 at a 95% confidence level, the table suggests a sample size of 370.
The Sample Size table for Finite Population recommended by Krejcie & Morgan (1970) is presented below:
4. Power Analysis (Field, 2013):
Power analysis is a statistical technique used to determine the minimum sample size required to detect a specific effect with a given probability.
The key components of power analysis include:
Effect Size (d): The magnitude of the difference or relationship being tested.
Significance Level (α): The probability of rejecting a true null hypothesis (typically set at 0.05).
Statistical Power (1 – β): The probability of correctly rejecting a false null hypothesis (commonly set at 0.80 or higher).
A higher effect size requires a smaller sample, while a lower effect size necessitates a larger sample for reliable results. Power analysis can be conducted using statistical software such as G*Power or R.
Sample Size Calculator
A Sample Size Calculator plays a crucial role in determining the appropriate sample size for a research study, ensuring that the results are statistically valid and reliable. It helps researchers calculate the minimum number of participants needed to detect a significant effect while considering factors such as population size, confidence level, margin of error, and effect size. By using a sample size calculator, researchers can avoid issues like underpowered studies, which may lead to inconclusive results, or excessively large samples, which can be resource-intensive.
For example, if an HR manager wants to study employee job satisfaction in a company with 5,000 employees, they can use a sample size calculator with a 95% confidence level and a 5% margin of error. Based on these inputs, the calculator (available in this website under “Utilities” menu) may suggest a sample size of approximately 357 employees. This ensures that the collected data is representative of the entire workforce, helping HR professionals make informed decisions about policies, employee engagement strategies, and workplace improvements.
Practical Example: Determining Sample Size for a Market Research Survey
Scenario:
A retail company in Chennai wants to understand customer satisfaction levels with its new product line. The total customer base is 10,000, and the company desires a 95% confidence level with a 5% margin of error.
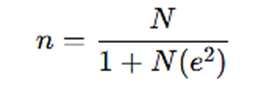
Using Yamane (1967) and Slovin’s Formula (Slovin, 1960):
Thus, the company needs to survey at least 385 customers to ensure reliable results.
Alternatively, using Krejcie and Morgan’s table (Krejcie & Morgan, 1970), a population of 10,000 suggests a required sample size of 370 at a 95% confidence level.
Practical Example by using various Method of Sample Size Calculation:
According to the World Population Review (2024), Chennai’s population was estimated to be 12,053,700 in 2024 (https://worldpopulationreview.com/cities/india/chennai)
By the end of 2024, Chennai’s population is estimated to reach approximately 1.20 crores (12 million). The required sample size for a consumer study on any product, service, or brand, as well as a study on employees in industries such as IT, automobiles, and others in Chennai, depends on key statistical factors, including confidence level, margin of error, and response distribution.
Sample Size Calculation
Assuming:
Population Size = 12,000,000 (1.20 crores) Confidence Level = 95%
Confidence Level = 95%
Margin of Error = 5%
Response Distribution = 50%
Using Slovin (1960) and Yamane (1967):
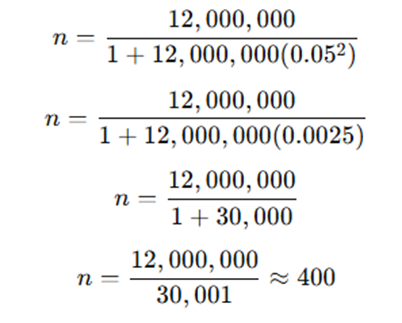
Using Slovin (1960) and Yamane (1967) the estimated sample size required is around 385-400 respondents (Consumers of any Product or Service/Brand or Employees of any Industry).
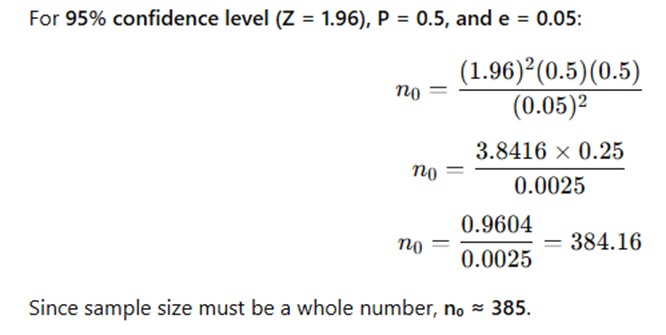
Using Cochran’s Formula (Cochran, 1977):
Cochran’s formula is widely used for calculating the sample size for large populations, particularly when dealing with proportions. It is given as:
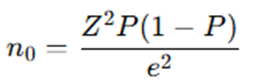
Z = Z-score (e.g., 1.96 for 95% confidence level)
p = Estimated proportion (assumed 0.5 if unknown)
E = Margin of error (expressed as a decimal, e.g., 0.05 for 5%)
n0 = Required Sample Size
Using Sample Size Calculator:
The same result i.e., 385 is provided.
You can freely use our Sample Size Calculator available in this website under “Utilities” Menu.
Adjustments Based on Accuracy Needs:
For a 3% margin of error, the required sample size increases to approximately 1,068 respondents.
For a 1% margin of error, the sample size would be much larger, around 9,500 respondents.
Therefore, for most consumer/employee/investors research studies in Chennai, a sample size of 385 respondents or 400 is appropriate and sufficient.
Comparison with Yamane/Slovin Formula:
Cochran’s formula is preferred when dealing with large populations and studies requiring high statistical rigor.
Yamane/Slovin formula is simpler and widely used in social sciences but may be less precise for studies requiring multivariate analysis (e.g., SEM, regression).
Sample Size for Academic Research
For doctoral research, a sample size of 385 is generally acceptable, especially for broad consumer or employee studies, if the study follows standard statistical guidelines with a 95% confidence level and a 5% margin of error (Cochran, 1977; Krejcie & Morgan, 1970). However, if detailed subgroup analysis, advanced statistical modeling, or higher accuracy is needed, a larger sample (from 400 to 10,000) should be considered.
Example: Sample Size Determination for a Survey on Customers of Digital Banking Services in Chennai
1. Context of the Study
A researcher conducting a doctoral study on customer satisfaction and adoption of digital banking services in Chennai needs to determine the appropriate sample size for robust statistical analysis, including multivariate techniques such as Exploratory Factor Analysis (EFA) and Structural Equation Modeling (SEM).
2. Sample Size Calculation (Basic Approach)
Population Size: Assume there are 2 million (20 lakhs) active digital banking customers in Chennai.
Confidence Level: 95%
Margin of Error: 5%
Response Distribution: 50%
Using Cochran’s or Yamane or Slovin’s formula or a sample size calculator, the required sample size for a basic survey would be around 385 or 400 respondents.
3. Sample Size Requirements for Multivariate Analysis
a) Exploratory Factor Analysis (EFA)
EFA is used to identify underlying latent factors in customer perceptions of digital banking.
Rule of Thumb: 10 respondents per variable (Hair et al., 2019).
If the survey has 30 questionnaire items, a minimum of 300 respondents is required.
However, to ensure factor stability, a sample size of 400+ is recommended.
b) Structural Equation Modeling (SEM)
SEM is used to test relationships between factors (e.g., Customers’ Perception on Perceived Convenience, Trust and Security, etc., Customer Satisfaction and Loyalty).
Rule of Thumb: Minimum 200–400 respondents (Byrne, 2016; Kline, 2015).
If the SEM model has 5–7 latent variables with 30–40 observed variables, at least 400–600 respondents are needed for reliable model fit.
4. Final Recommended Sample Size
Basic Descriptive & Regression Analysis: 385–400 respondents
EFA and SEM: 400–600 respondents
For a Doctoral Study on digital banking customers in Chennai, the sample size should generally be around 400 to 500 respondents.
Justification for Choosing 385 or 400 Respondents as Sample Size:
Statistical Representativeness – With a 95% confidence level and a 5% margin of error, 385 respondents (or 400) provide a reliable estimate of consumer behaviour or Employee Behaviour without excessive data collection efforts. According to Cochran’s formula for sample size determination, when the population is large, the required sample size stabilizes around 385 (Cochran, 1977).
Diminishing Returns – Research shows that when the population size exceeds 100,000, the required sample size remains stable beyond a certain point (Krejcie & Morgan, 1970). This means for a large population like 1.20 crores, increasing the sample size beyond 385 provides only marginal accuracy improvements.
Practical Feasibility – Collecting responses from 385 participants is manageable in terms of time, cost, and resources, making it an efficient choice for most studies (Saunders, Lewis, & Thornhill, 2019). A larger sample size, such as 1,068 respondents (3% margin of error), is only necessary when higher precision is needed, such as for government policy decisions or high-stakes business investments.
Conclusion
Sample size determination is an essential step in research design, ensuring that findings are statistically sound and generalizable (Creswell, 2018). For a known population, Slovin’s formula is a suitable choice as it directly incorporates the total population size into the calculation (Slovin, 1960). For an unknown population, Cochran’s formula is recommended as it estimates the required sample size without prior knowledge of the total population (Cochran, 1977). For finite populations, Krejcie and Morgan’s table provides a quick reference for determining sample sizes without complex calculations (Krejcie & Morgan, 1970). Power analysis is a valuable tool for ensuring the study has sufficient statistical power to detect meaningful effects (Field, 2013). Sample Size Calculator is also useful and is considered as one of the major sources for sample size calculation/determination. Power analysis can also be conducted using statistical software such as G*Power or R for Sample Size calculation but we need to download and use of them. By considering factors like confidence level, population size, and effect size, researchers can make informed decisions that optimize study accuracy and efficiency.
Do you struggle in calculating the ideal Sample Size for your research? Feel free to contact us or leave a comment below!
References
Byrne, B. M. (2016). Structural Equation Modeling with AMOS: Basic Concepts, Applications, and Programming (3rd ed.). Routledge.
Cochran, W. G. (1977). Sampling Techniques (3rd ed.), John Wiley & Sons.
Creswell, J. W. (2018). Research Design: Qualitative, Quantitative, and Mixed Methods Approaches. SAGE Publications.
Field, A. (2013). Discovering Statistics Using IBM SPSS Statistics. SAGE Publications.
Hair, J. F., Black, W. C., Babin, B. J., & Anderson, R. E. (2019). Multivariate Data Analysis (8th ed.). Cengage.
Kline, R. B. (2015). Principles and Practice of Structural Equation Modeling (4th ed.). Guilford Publications.
Krejcie, R. V., & Morgan, D. W. (1970). Determining Sample Size for Research Activities. Educational and Psychological Measurement, 30(3), 607-610.
Saunders, M., Lewis, P., & Thornhill, A. (2019). Research Methods for Business Students (8th ed.). Pearson.
Slovin, E. (1960). Formula for Sample Size Determination. https://prudencexd.weebly.com/
Yamane, Taro. (1967). Statistics: An Introductory Analysis, 2nd Edition, New York: Harper and Row.


Leave a Reply