


Understanding Data Analysis and its Types
Data analysis is the process of examining, cleaning, transforming, and interpreting data to uncover meaningful insights and make informed decisions. It is used across various fields, including business, healthcare, education, and research, to drive strategies and understand patterns. In social sciences, data analysis plays a vital role in exploring human behavior, societal trends, and relationships among variables.
Social science research often deals with complex and multifaceted data, requiring careful analysis to generate actionable insights. Data analysis in this field can help identify patterns in social behavior, measure public opinion, evaluate the effectiveness of policies, and understand cultural trends.
Whether analyzing survey results, census data, or experimental outcomes, data analysis in social sciences enables researchers to establish evidence-based conclusions that contribute to social policies, community development, and academic knowledge. Understanding different types of data analysis and their practical applications helps both novice and experienced researchers navigate complex datasets efficiently and effectively.
Types of Data Analysis
Data analysis can be categorized in several ways, depending on the statistical tools, the type of data, research design and methodology, etc. Below are some common categories:
1. Based on Statistical Tools and Purpose
(a) Descriptive Analysis
Descriptive analysis focuses on summarizing and describing the features of a dataset. It provides insights into what has happened in the past by using measures such as averages, percentages, and charts.
Statistical Tools:
Mean, median, mode, standard deviation, variance, frequency distribution, histograms, bar charts, etc.
Practical Examples:
- A company analyzes last quarter’s sales data to determine the average revenue per product and identify the best-selling items. They also use charts to visualize sales patterns across different regions.
- Analyzing Instagram posts to summarize the number of likes, comments, and shares over a period of time.
- Analyzing monthly sales data to calculate the average sales per store (mean) and the variation in sales across stores (standard deviation).
- Calculating the average (mean) satisfaction score from a customer feedback survey.
- Reporting on monthly sales performance, including average sales per employee, highest and lowest sales, etc.
(b) Inferential Analysis
Inferential Analysis involves drawing conclusions and making predictions about a population based on data collected from a sample. It helps generalize findings beyond the observed data and assess relationships between variables.
Statistical Tools:
T-tests, ANOVA, Correlation, Regression, etc.
Practical Examples:
- Examining the impact of various digital advertising practices on customer satisfaction (Multiple Regression Analysis)
- Using a sample of 100 patients to test if a new drug significantly improves recovery time (T-tests or ANOVA).
- Analysing the relationship between Job Satisfaction and Work Performance among the employees of the particular industry.
(c) Predictive Analysis
Predictive analysis uses historical data to forecast future trends and events. Techniques such as statistical modelling, etc. are employed to make predictions.
Statistical Tools:
Regression models, Time series analysis, Decision Trees, etc.
Practical Examples:
- A bank uses predictive analysis to forecast loan defaults by analysing customer credit history, spending patterns, and previous repayment behaviour.
- Predicting stock prices based on the past data (linear regression).
- Using past shopping patterns to predict the likelihood of a customer returning to make another purchase.
- Predicting customer churn based on previous purchase behaviour and demographic data.
- Using historical climate data to predict future weather conditions.
(d) Prescriptive Analysis
Prescriptive analysis suggests actions to achieve desired outcomes. It uses algorithms and optimization techniques to recommend the best course of action.
Statistical Tools:
Linear, Multiple and Logistic Regression, Cluster Analysis, Factor Analysis, Time Series Analysis, Conjoint Analysis, Linear programming, Simulation models, Optimization algorithms, Decision-support systems, etc.
Practical Examples:
- Prescribing personalized marketing strategies based on customer segmentation (Cluster Analysis)
- Prescribing brand positioning strategies by identifying key attributes that drive customer perception (Factor Analysis)
- Recommending production schedules based on demand forecasts using ARIMA models. (Time Series Analysis)
- Using data on employee performance to recommend training or role changes (Cluster Analysis or Decision Tree Analysis).
- A logistics company uses prescriptive analysis to determine the most efficient delivery routes by considering factors such as traffic patterns, weather conditions, and delivery deadlines (Linear Programming or Simulation Analysis).
- Using optimization models to recommend how much inventory a store should stock based on demand forecasts (Linear programming).
- Recommending the best promotional strategy to increase sales based on consumer behaviour models (Cluster Analysis or Conjoint Analysis).
(e) Diagnostic Analysis
Diagnostic analysis focuses on identifying the root causes of events, patterns, or issues by analyzing historical data. It goes beyond descriptive analysis by answering the “why” behind trends or anomalies.
Statistical Tools:
Correlation analysis, Root cause analysis, Regression analysis, etc.
Practical Examples:
- A company analysing customer churn may use diagnostic analysis to discover whether poor customer service or high pricing is the primary reason for dissatisfaction.
- Analysing why customers stopped using a service by looking at their interactions with the company.
- Identifying why a machine failed by analysing maintenance logs and operational data.
2. Based on Data Type
Researchers often rely on both quantitative and qualitative data analysis methods to gain a comprehensive view of their subjects.
(a) Quantitative Data Analysis
Quantitative analysis involves numerical data and statistical tools to measure and interpret social phenomena. Descriptive statistics, inferential statistics, and modeling techniques are common approaches.
Statistical Tools:
Descriptive statistics, T-tests, ANOVA, regression analysis, Correlation, etc.
Practical Examples:
- A social scientist examines survey responses on public satisfaction with government services. They calculate the mean satisfaction score and perform a t-test to compare satisfaction levels across different demographic groups.
- Using regression analysis to examine the relationship between advertising spending and sales revenue.
- Analysing patient data to find correlations between age, lifestyle, and disease outcomes.
- Analyzing survey responses about spending habits using statistical tests like chi-square tests.
(b) Qualitative Data Analysis
Qualitative analysis focuses on non-numerical data such as interviews, observations, and text, providing deeper insights into social contexts and experiences.
Tools:
Text Analysis, Thematic Analysis, Content Analysis, Narrative Analysis, etc.
Practical Examples:
- A researcher analyzes interview transcripts from a study on consumer opinions about green products. Using thematic analysis, they identify recurring themes like environmental consciousness, product quality concerns, and brand loyalty.
- Analyzing open-ended responses to identify common themes.
- Analyzing group discussions to understand consumer attitudes toward a new product.
- Analysing customer feedback from open-ended survey questions to identify common themes (e.g., frustrations with a product).
- Analysing tweets or Facebook posts to detect public sentiment about a product or event.
- Analyzing tweets to detect public sentiment about a product.
- Analyzing news articles or blogs to understand public discourse on a social issue (Content analysis).
(c) Mixed Methods Analysis
Combine qualitative and quantitative approaches for a holistic understanding of a problem.
Tools:
Both the above quantitative (statistical) and qualitative tools can be applied.
Practical Examples:
- Using surveys to quantify satisfaction (quantitative) and conducting follow-up interviews to explore reasons behind the scores/rating (qualitative).
- Using test scores (quantitative) and student interviews (qualitative) to understand the effectiveness of a new teaching method.
- Measure changes in patient health indicators (e.g., blood pressure, cholesterol levels) after a new treatment (quantitative) and conduct Interview with patients (qualitative) to understand their experiences and adherence challenges.
3. Based on Research Design
(a) Cross-sectional Analysis
Cross-sectional analysis involves examining data at a single point in time to capture a snapshot of variables and their relationships. It is widely used in surveys, market research, and demographic studies. This method helps identify patterns, differences, or associations within the dataset without tracking changes over time.
Statistical Tools:
Descriptive Statistics, Frequency Distributions, Chi-Square Tests, etc.
Practical Examples:
- Analyzing population data at one point in time to understand the demographic distribution.
- Conducting a one-time survey to understand consumer preferences for a new product.
- A medical company may conduct a survey to analyze the health status of particular population at a particular point in time.
(b) Longitudinal Analysis
Longitudinal analysis involves collecting and analyzing data over multiple time points to track changes, trends, or patterns within the same subjects or variables. This approach is valuable for understanding how factors evolve over time and for establishing causal relationships.
Statistical Tools:
Matched-pair t-test, Repeated Measures ANOVA, Time Series Analysis, Growth Models, Survival Analysis, etc.
Practical Examples:
- Tracking a group of people over 10 years to study the effects of diet on long-term health.
- Measuring job satisfaction and engagement at regular intervals to assess how changes in company policy affect morale.
- A health research study may track patients’ blood sugar levels over five years to assess the impact of a new medication,
- An employee engagement survey may be conducted annually to monitor changes in job satisfaction following policy changes.
- Measuring students’ test scores at the beginning and end of an academic term to assess the effectiveness of a new teaching method.
(c) Comparative Analysis
Comparative analysis involves evaluating two or more groups, periods, or datasets to identify differences, similarities, and trends. It is widely used in business, education, healthcare, and social research to gain insights by comparing variables across different conditions.
Statistical Tools:
ANOVA, Independent Sample t-tests, Chi-Square Tests, Mann-Whitney U tests, etc.
Practical Examples:
- Comparing customer satisfaction scores across different regions to see which region has the highest satisfaction.
- Comparing test scores between students who attended public vs. private schools.
- Comparing the effectiveness of two different treatment methods for the same illness using ANOVA to analyze variations in recovery times.
- Evaluating sales performance before and after a promotional campaign using a paired t-test to assess the impact.
(d) Causal Analysis
Causal analysis focuses on identifying and understanding cause-and-effect relationships between variables. It aims to determine how changes in one factor directly influence another. This type of analysis is essential in fields like healthcare, economics, education, and marketing. Causal analysis is particularly valuable for evidence-based decision-making as it helps distinguish mere correlations from genuine cause-and-effect relationships.
Statistical Tools:
Regression Analysis, Granger causality tests, Path Analysis, Structural Equation Modeling (SEM), etc.
Practical Examples:
- Analysing the effect of exercise on blood pressure (regression analysis).
- Studying the impact of class size on student performance (experimental designs).
- Using structural equation modeling (SEM) to determine whether an increase in advertising budget directly influences sales growth while accounting for other variables like seasonality and product availability.
- Investigating whether reducing class sizes has a direct impact on student performance using ANOVA or path analysis in controlled experimental setups.
- Using Granger causality tests to examine whether a carbon tax policy reduces pollution levels over time.
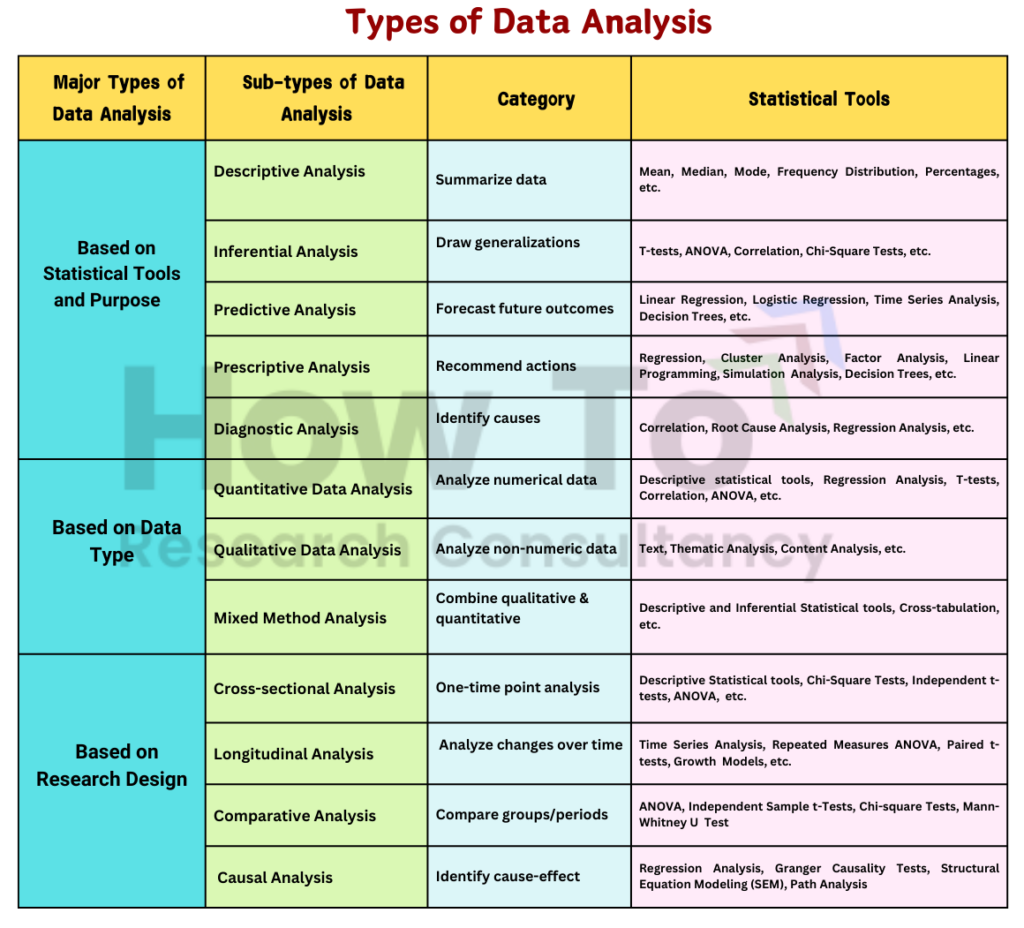
The following table provides a clear overview of types of data analysis and their corresponding statistical tools, helping to choose appropriate methods based on the research question, data availability, and study objectives. Each type of analysis has a specific purpose and methodology, ensuring a tailored approach for meaningful insights.
Conclusion
Data analysis plays a crucial role in transforming raw data into actionable insights, enabling researchers and organizations to make informed decisions. By leveraging appropriate statistical tools and combining both qualitative and quantitative approaches where necessary, researchers can ensure a comprehensive understanding of their data, ultimately driving valuable outcomes that inform strategy and decision-making.
If you are seeking expert guidance on selecting the right data analysis techniques for your research, feel free to reach out. Let us transform your data into meaningful insights that drive impactful decisions!


Leave a Reply