


In today’s data-driven world, researchers often encounter situations where they need to examine the effect of independent variables on multiple dependent variables simultaneously. This is where MANOVA (Multivariate Analysis of Variance) becomes an essential statistical tool. In this blog, we’ll break down what MANOVA is, why it’s used, how to conduct it, and explore practical examples across different domains like education, marketing, and healthcare.
What is MANOVA?
MANOVA (Multivariate Analysis of Variance) is an extension of ANOVA (Analysis of Variance). While ANOVA tests for mean differences among groups on a single dependent variable, MANOVA tests for differences on two or more dependent variables simultaneously.
Purpose of using MANOVA:
To examine how one or more independent variables affect multiple related outcomes at the same time and you want to understand the overall pattern of group differences. This reduces Type I error (false positives) that occur when running separate ANOVAs.
MANOVA is used when you have Multiple dependent variables (DVs), and one or more independent variables (IVs). It helps determine if your groups (based on IVs) differ on a combination of DVs that are related.
Example: Suppose you want to know whether different Training Programs (IVs – Categorical – e.g., A, B, C) affect Employee Productivity, Job Satisfaction, and Stress Levels (3 DVs).
If p < 0.05, it means training program significantly affects the combined dependent variables.
Rather than running separate ANOVAs for each outcome, MANOVA lets you test them together, which saves time and reduces error. It’s useful when your dependent variables are related and you want a holistic view of the impact.
Real-World Examples from Various Domains of Study
1. Education Research
- Research Question: Does teaching method (Lecture-based vs. Activity-based) influence student performance in Accounting and Statistics?
- IV: Teaching method (categorical)
- DVs: Scores in Accounting and Statistics (continuous)
2. Marketing
- Research Question: Does the type of advertisement (Video, Banner, Text) affect Brand Recall, Purchase Intention, and Customer Engagement?
- IV: Ad type
- DVs: Brand Recall Score, Purchase Intention Score, Customer Engagement level
3. Healthcare
- Research Question: Do different diet plans impact cholesterol, blood pressure, and BMI levels in patients?
- IV: Type of diet (Keto, Mediterranean, Low-Fat)
- DVs: Cholesterol level, BP, BMI (all continuous)
TWO MORE EXAMPLES OF MANOVA
MANOVA Example in Economics
- Research Objective: To study the impact of monetary policy strategies on multiple economic indicators.
- Independent Variable (IV): Type of Monetary Policy (Expansionary, Contractionary, Neutral)
- Dependent Variables (DVs): Inflation Rate, GDP Growth Rate, Unemployment Rate
- Study Design: A One-Way MANOVA is used to examine whether different monetary policies significantly affect the combination of inflation, growth, and unemployment.
- Usefulness: Instead of analyzing each economic outcome separately, MANOVA helps determine if the overall economic performance profile differs across policy types, while considering the interrelation between the indicators.
MANOVA Example in Tourism
- Research Objective: To assess how types of tourism packages and traveler origin influence tourist satisfaction and destination loyalty.
- Independent Variables (IVs): Type of Tourism Package (e.g., Adventure, Cultural, Relaxation) and Traveler Region (Domestic vs. International)
- Dependent Variables (DVs): Tourist Satisfaction, Intention to Revisit, Likelihood to Recommend
- Study Design: A Factorial MANOVA is conducted to examine the interaction effect of package type and traveler origin on a combination of satisfaction and loyalty-related outcomes.
- Usefulness: This allows researchers to understand not just isolated effects, but whether certain combinations (e.g., international adventure tourists) are more or less satisfied or loyal than others — with statistical control for multiple comparisons.
Steps to Conduct MANOVA
Step 1: Define Your Hypotheses
Formulate null and alternative hypotheses:
- H0: There is no difference in the combined dependent variables across groups.
- H1: There is a significant difference in at least one linear combination of the dependent variables across groups.
Step 2: Check Assumptions
MANOVA has several assumptions. Here’s how to verify them:
| Assumption | What to Do |
| Multivariate normality | Use Shapiro-Wilk or Q-Q plots for each DV |
| Homogeneity of variances | Use Levene’s Test |
| Homogeneity of covariance | Use Box’s M test |
| Linearity | Check scatterplot matrices between DVs |
| No multicollinearity | Correlation coefficients should be < 0.90 |
| Random sampling | Ensure data is collected from a representative sample |
Step 3: Perform MANOVA Analysis
Use statistical software like SPSS, R, Python (Statsmodels), or SAS.
Example in SPSS:
- Go to Analyze > General Linear Model > Multivariate
- Select your dependent variables
- Add your independent variable (grouping factor)
- Click Options to include descriptive stats and effect size
- Interpret Wilks’ Lambda, Pillai’s Trace, etc.
Step 4: Interpret MANOVA Results
Key multivariate test statistics:
| Statistic | Interpretation |
| Wilks’ Lambda | Lower values = group means differ across DVs |
| Pillai’s Trace | More robust to assumption violations |
| Hotelling’s T² | Used for two-group comparisons |
| Roy’s Largest Root | Sensitive to one strong difference |
If the multivariate test is significant (p < 0.05), proceed with univariate ANOVAs to know which DVs differ across groups.
Step 5: Post Hoc Tests and Effect Size
- Conduct univariate ANOVAs on each dependent variable.
- Use Bonferroni or Tukey HSD post hoc tests if there are more than two groups.
- Calculate partial eta squared for effect size.
Reporting MANOVA Results
Example:
“A MANOVA was conducted to examine the effect of advertisement type on brand recall, purchase intention, and engagement. The multivariate test using Wilks’ Lambda was significant, Λ = .85, F(6, 200) = 3.21, p = .004, indicating a significant difference across ad types. Univariate ANOVAs revealed significant differences in brand recall (p = .01) and purchase intention (p = .03), but not in engagement (p = .12).”
TYPES OF MANOVA
MANOVA can be categorized into different types based on the structure and complexity of the independent variables and the study design. Here are the main types of MANOVA commonly used in research:
Each type of ANOVA has a unique use case, and the right choice depends on:
- The number of groups and variables,
- Whether you’re measuring once or repeatedly,
- And whether you’re looking at single or multiple outcomes that are related.
1. One-Way MANOVA
Definition: A MANOVA with one independent variable (factor) having two or more levels/groups and two or more dependent variables.
Use Case Example (Education):
A researcher wants to test whether Teaching Method (Lecture, Group Discussion, Blended Learning) affects students’ scores in Math, Science, and English.
- IV: Teaching Method (3 groups)
- DVs: Math Score, Science Score, English Score
Use One-Way MANOVA when you want to test for group differences on multiple outcomes with only one factor.
2. Two-Way MANOVA (Factorial MANOVA)
Definition: A MANOVA with two independent variables, each with two or more levels, and multiple dependent variables.
Use Case Example (Marketing):
To study how ad type (Video vs. Banner) and Platform (Instagram vs. YouTube) influence Brand Recall and Purchase Intention.
- IVs: Ad Type, Platform (2×2 factorial design)
- DVs: Brand Recall, Purchase Intention
Two-Way MANOVA allows you to test for main effects of each IV and interaction effects between them on multiple DVs.
3. Repeated Measures MANOVA (Within-Subjects MANOVA)
Definition: A MANOVA where the same participants are measured on multiple dependent variables or the same dependent variables across multiple time points.
Use Case Example (Healthcare):
Evaluating the impact of a Diet Program on participants’ Cholesterol, Blood Pressure, and BMI measured at Baseline, 3 months, and 6 months.
- IV: Time (within-subjects factor)
- DVs: Cholesterol, BP, BMI
Repeated Measures MANOVA accounts for the correlation between repeated observations from the same subjects over time.
4. Mixed-Design MANOVA (Split-Plot MANOVA)
Definition: Combines between-subjects and within-subjects factors in the same MANOVA.
Use Case Example (Psychology):
Testing the effectiveness of therapy type (Cognitive Behavioural Therapy (CBT) vs. Medication) on Stress and Anxiety levels measured at Pre-treatment and Post-treatment.
- Between-Subjects IV: Therapy Type
- Within-Subjects IV: Time (pre vs. post)
- DVs: Stress Level, Anxiety Level
Mixed MANOVA is suitable when some factors vary between groups, while others vary within the same group over time.
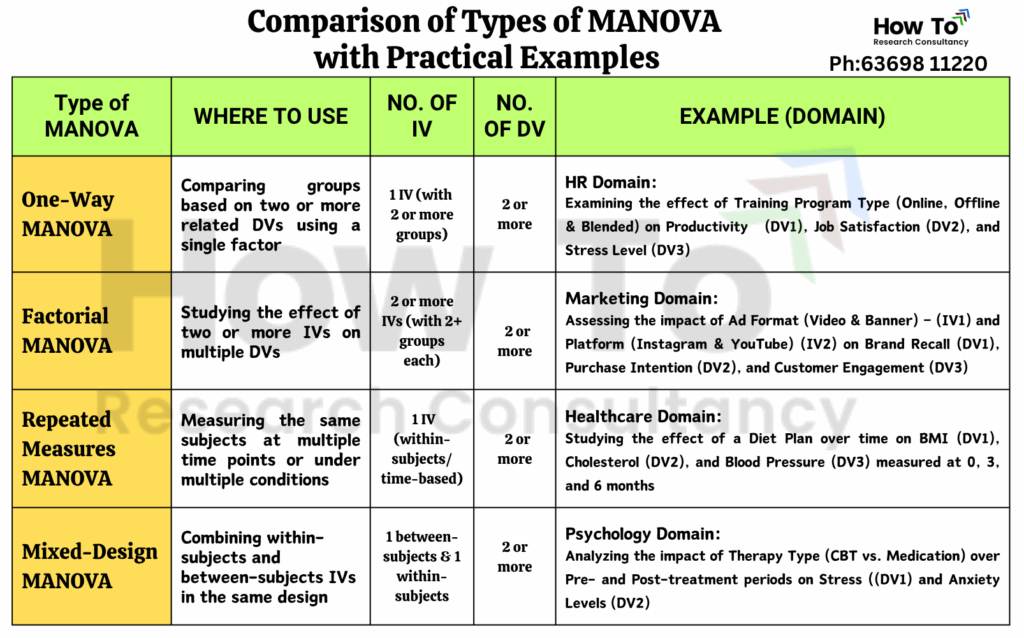
Check out the summary table below for a clear and simple comparison of the four types of MANOVA with practical examples of different domains of study, making it easier to understand which one suits your research needs.
Why not just run separate ANOVAs instead of MANOVA?
You can run individual ANOVAs or Multiple ANOVAs, but if you have multiple dependent variables, MANOVA has several clear advantages over running separate ANOVAs. Here’s why:
When comparing MANOVA and multiple ANOVAs, the key distinction lies in how they handle multiple dependent variables. MANOVA conducts a single test that evaluates whether there are significant group differences across a combination of two or more interrelated dependent variables. This multivariate approach controls the overall Type I error (false positives) rate and considers the correlations among the dependent variables, making it a more powerful and statistically efficient method.
In contrast, running separate ANOVAs for each dependent variable increases the risk of Type I error (false positives) due to multiple comparisons and ignores the potential interrelationships (Separate ANOVAs ignore relationships between DVs) among the outcomes, which can lead to misleading results.
Running multiple ANOVAs is like flipping a coin multiple times — the more you flip, the higher the chance of getting “lucky heads” (false positives). MANOVA reduces that risk.
While ANOVAs test each dependent variable independently, MANOVA provides a more holistic view by analysing the overall effect (combined effect) of the independent variable(s) on the dependent variable profile. This is especially important when the pattern across variables matters more than any single variable.
MANOVA allows a single overall test for group differences across multiple outcomes. This makes the analysis cleaner, more efficient, and better aligned with your study goals if your research question is multivariate in nature.
Why do we run individual ANOVAs after MANOVA?
Because MANOVA tells us “Something is different” — it’s like a first filter.
Then, univariate ANOVAs tell us “What exactly is different.”
MANOVA is preferable when the dependent variables are conceptually or statistically related, whereas individual ANOVAs may be used when the outcomes are completely independent or only one dependent variable is of interest.
Conclusion
MANOVA is a powerful tool when dealing with multiple dependent variables and looking to explore group differences in a more comprehensive way than univariate tests allow. Whether you’re in social sciences, business, health, or education, MANOVA helps in understanding the multivariate impact of independent variables — helping researchers draw more meaningful conclusions from complex data sets.
Do you need any assistance? contact us!


Leave a Reply