


Introduction
In research, particularly in the social sciences, we often deal with concepts that are not directly observable. These are known as latent constructs or latent variables or underlying factors. For example, concepts such as customer satisfaction, brand loyalty, motivation, emotional intelligence, employee engagement, etc. are not directly measurable but can be inferred from responses to related survey questions.
Factor
A factor is an unobservable (latent) variable that influences responses to observed variables (e.g., questionnaire items). For instance, if several survey questions relate to how helpful and friendly a staff is, they might all be explained by a single underlying factor called “Service Quality.”
Factor Analysis
Factor Analysis is a multivariate statistical technique or method used to identify these hidden variables by analysing the relationships or correlations among observed/measured variables (such as questionnaire items). This technique helps researchers group related items together and uncover the dimensions underlying large sets of data.
It is also a data reduction technique. It helps reduce a large set of observed variables into a smaller number of underlying factors (latent variables or constructs) that explain the patterns of correlations among the observed variables. In short, factor analysis condenses information from many variables into a few factors, making it a powerful tool for simplifying complex data sets.
Note: “Latent variable” is more general (used in many statistical models) and “Underlying factor” is more specific to factor analysis.
Types of Factor Analysis
There are two main types of factor analysis:
- Exploratory Factor Analysis (EFA): Used when the underlying structure is unknown. It helps identify the number and nature of factors. We identify underlying factors (or latent constructs) by analysing how observed items group together.
- Confirmatory Factor Analysis (CFA): Used to test whether a specified factor structure (based on theory or previous research) fits the observed data. We test how well our observed variables represent predefined latent variables.
EFA is like detective work — you let the data tell you how many factors exist and what variables load onto them.
CFA is like jury work — you test whether the structure you hypothesized is supported by the data.
Both are equally important but serve different purposes in the research process:
- Use EFA first when the structure of the data is not yet known or when developing a new measurement scale.
- Use CFA later to statistically validate that the structure discovered through EFA holds across samples or contexts.
If you’re in the initial stages of your research or dealing with new survey items, then EFA is essential. If you already have a well-established model or you’re testing theoretical constructs, CFA becomes more critical.
Think of EFA like exploring an unfamiliar city — you walk around and see what areas (factors) naturally emerge from your exploration. Think of CFA like using a map in that same city — you already know where the areas are supposed to be and you’re checking if they exist as expected.
In short, EFA helps you explore, while CFA helps you confirm the structure.
This comprehensive guide will walk you through the step-by-step process of Exploratory Factor Analysis (EFA), enriched with practical examples to help you understand how it works in real-life research scenarios.
Exploratory Factor Analysis (EFA)
“Exploratory” means you’re exploring the data without prior assumptions about the number or nature of the factors. Exploratory Factor Analysis (EFA) is a powerful multivariate statistical technique used in research to uncover the underlying structure of a large set of observed variables. Often employed in psychology, social sciences, marketing, and business research, EFA helps researchers identify latent constructs or “factors” that explain the patterns of correlations among variables. It’s particularly useful in scale development, survey analysis, and psychometric validation.
Exploratory Factor Analysis (EFA) is also a data reduction technique. It identifies clusters of variables that are highly correlated with each other and represents them as a single latent factor (not observed directly). Unlike Confirmatory Factor Analysis (CFA), EFA does not impose a pre-defined structure and is exploratory in nature.
EFA seeks to identify latent constructs (unobservable variables) that explain the correlations among a set of observed variables (items in a questionnaire). These constructs are called “Factors”.
Think of it as grouping similar survey items together, where each group (factor) reflects a common underlying theme or construct, like “service quality” or “brand loyalty.”
When to use EFA?
Use EFA when:
- You don’t have a predefined theory or model about the structure of your data.
- You aim to develop a new measurement scale or validate an existing one.
- You want to reduce a large number of variables into fewer, interpretable dimensions.
- You want to uncover the latent structure (factors) without predefined assumptions.
- You want to examine a Dependent Variable (DV1 or DV2) which has many items, and want to explore its dimensionality.
Step-by-Step Procedure to conduct EFA with Examples
Step 1: Collect and Prepare your Data
- Use a structured questionnaire with at least 3–5 items per construct.
- Ensure responses are on an interval/ratio or ordinal scale (e.g., Likert).
- General rule: At least 5–10 responses per item. (10+ respondents per item is ideal)
- Aim for a minimum of 150–200 responses; 300+ provides more stability.
- If you have 15 questionnaire items, a sample size of 200–300 is considered robust.
Example: You design a 15-item survey to assess customer satisfaction. You collect responses from 200 participants. That’s roughly 13 respondents per item — ideal for EFA.
Also, check for missing values, outliers and Normality.
Step 2: Check the Suitability of Data for Factor Analysis
Run two tests to check whether your dataset is suitable for factor analysis:
- Kaiser-Meyer-Olkin (KMO): Measures sampling adequacy; Values range from 0 to 1. The value should be > 0.6 (More than 0.8 is great)
- Bartlett’s Test of Sphericity: Tests whether the correlation matrix is significantly different from an identity matrix (i.e., variables are correlated).
- Tests if correlations between items are sufficient for factor analysis.
- P-value should be < 0.05 (statistically significant)
These tests ensure that your data has enough shared variance (common influence of a factor) to justify factor analysis.
Example Output (SPSS):
KMO = 0.812 → Good
Bartlett’s Test: Chi-square = 563.89, df = 66, p < 0.001 → Significant
Step 3: Choose an Extraction Method
This step involves deciding how the factors will be extracted from your correlation matrix.
- Principal Component Analysis (PCA): Focuses on total variance; often used for data reduction but not ideal for identifying latent variables.
- Principal Axis Factoring (PAF): Focuses on common variance; more suitable for identifying latent constructs.
- Maximum Likelihood (ML): Assumes multivariate normality; useful when inferential statistics (like goodness-of-fit) are needed.
Use PAF when the goal is to understand underlying dimensions, not just reduce data.
Step 4: Determine Number of Factors
Use these criteria:
- Eigenvalue > 1 rule (Kaiser Criterion): Retain factors with eigenvalues > 1.
- Scree Plot: Visual method (graphical display); Look for the “elbow” — the point after which the slope of the curve becomes flat. Retain all factors before this point.
- Parallel Analysis (Advanced): Compares actual eigenvalues to those generated from random data. Retain factors whose eigenvalues exceed those of the random data.
Example: Scree plot shows a clear elbow after 3 factors → Retain 3 factors.
Step 5: Choose Rotation Method (for Interpretability)
Rotation helps in making the factor structure more interpretable by maximizing high loadings and minimizing low ones.
- Orthogonal Rotation (Varimax): Assumes factors are uncorrelated. Good for simplifying and interpreting dimensions.
- Oblique Rotation (Promax, Oblimin): Allows factors to correlate. Suitable when theory or data suggests relationships among constructs.
Use Varimax if you’re developing a new measurement scale and want distinct factors.
Psychological constructs are often interrelated, making oblique rotation generally more appropriate.
Step 6: Interpret Factor Loadings
Now analyse which items load on which factor:
- Factor loadings represent correlations between an item and a factor.
- Loadings > 0.40 are considered acceptable; > 0.60 are strong.
- Items should ideally load highly on one factor and very low on others i.e., each item should load strongly on one factor only.
- Remove or revise the items with high cross-loadings (loading significantly (> 0.40) on more than one factor).
- Delete items with low loadings (< 0.40)
- Ensure each factor has at least 3 items with strong loadings.
Step 7: Name the Factors
Finally, name your factors based on the common theme among the items loading on each one.
Example: Items about Convenience, Ease of navigation, and Accessibility may be labeled as “User Experience.”
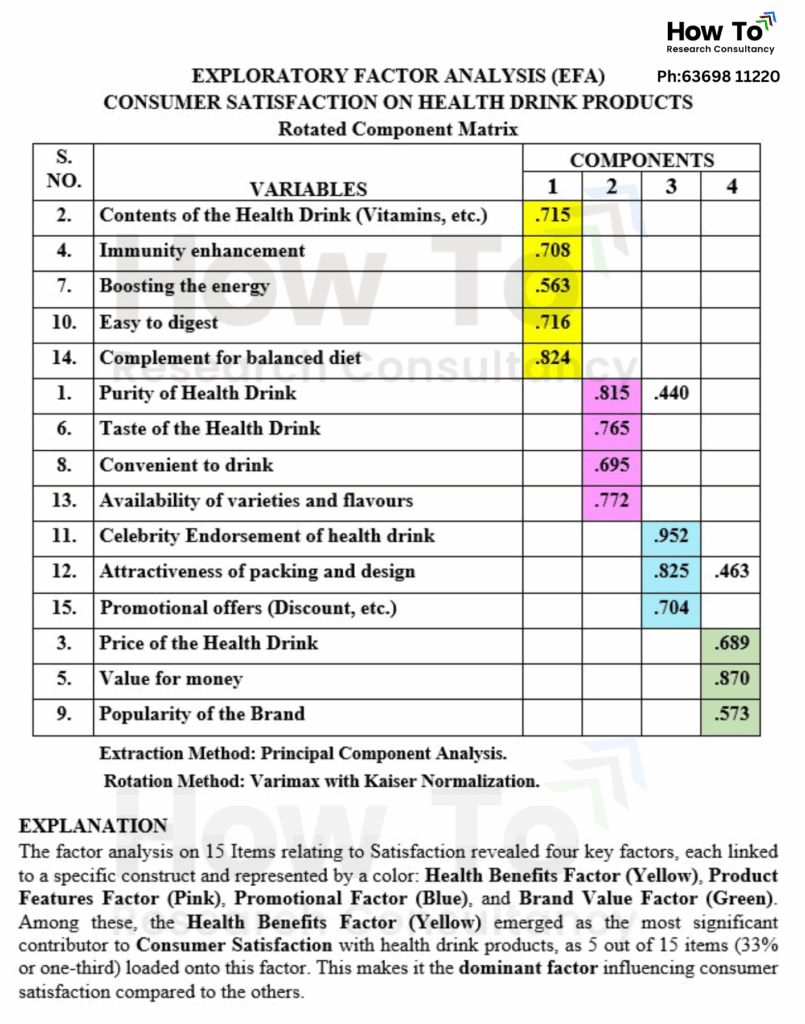
See below the example EFA Table and its explanation (Consumer Satisfaction on Health Drink Products):
Additional Tips (Check Reliability)
- Use reliability analysis (Cronbach’s alpha) for each factor to check internal consistency.
- Alpha values > 0.7 are considered acceptable.
- Avoid naming factors too generally; names should reflect item content.
- Report the following:
- KMO and Bartlett’s test results
- Total variance explained
- Factor loadings
- Rotation method used
- Alpha values > 0.7 are considered acceptable.
- This ensures that items within a factor consistently measure the same underlying concept.
When EFA is Enough
- If you’re exploring a new dimension within a known variable (like DV1 or DV2).
- When you are not aiming to generalize to a wider theory but want to understand your specific dataset.
Final Thoughts
EFA is an essential tool for scale development, instrument validation, and construct identification. Whether you’re building a new questionnaire or understanding consumer behaviour patterns, mastering EFA gives you deep insights from complex data.
Need help running EFA for your dataset or interpreting the results? Feel free to reach out!


Leave a Reply