


In research, comparing the means of two independent groups is a common requirement to validate a hypothesis or test a theory. The Independent Sample ‘t’ Test, also known as the two-sample t-test, is a fundamental statistical tool used for this purpose. It helps determine whether a significant difference exists between the averages (means) of two unrelated groups.
This blog explains the Independent Sample ‘t’ Test in simple terms and illustrates its usage through practical examples from different domains such as business, education, healthcare, economics, and tourism.
What is the Independent Sample ‘t’ Test?
The Independent Sample ‘t’ Test compares the means of two independent groups (unrelated groups such as Male and Female) to see if the difference between them is statistically significant. For valid results, the test assumes that the dependent variable is normally distributed and measured on a continuous scale, and that the two groups have equal variances.
Types of Data Suitable for Independent Sample ‘t’ Test
To use the Independent Sample ‘t’ Test effectively, ensure your data meets the following criteria:
Dependent Variable (DV): Should be continuous (interval or ratio scale), e.g., income, satisfaction score, test marks, etc.
Independent Variable (IV): Should be categorical with two independent groups, e.g., male/female, treatment/control, online/offline.
When to Use the Independent Sample ‘t’ Test?
Use this test when:
- You want to compare means between two distinct groups.
- The two groups are independent (not repeated measures on the same subjects).
- The outcome (dependent) variable is numerical and approximately normally distributed.
Steps to Perform the Test
1. Formulate Hypotheses
Null hypothesis (H₀): μ₁ = μ₂ (no difference in means)
Alternative hypothesis (H₁): μ₁ ≠ μ₂ (means are different)
2. Set significance level
Generally, and commonly set α = 0.05 or 5%
3. Calculate the t-value and p-value
By using software like SPSS, Excel, etc.
4. Decision rule
If p < 0.05 → Reject H₀ → Significant difference
If p ≥ 0.05 → Fail to reject H₀ → No significant difference
5. Interpret the result in the context of your domain.
Example of Reporting
An Independent Sample ‘t’ Test was conducted to compare income levels in rural and urban households. Results indicated a significant difference in income (t(118) = 3.12, p = 0.002), with urban households earning higher on average.
Key Assumptions of Independent Sample ‘t’ Test
To apply this test accurately, the following assumptions must be satisfied:
Independence: Each group must be independent; no overlap in participants.
Normality: The normality assumption requires that the dependent variable is approximately normally distributed within each group. This can be assessed using tests like the Shapiro-Wilk test or visually through Q-Q plots and Histograms.
Homogeneity (Equal) of Variances: The variances in the two groups should be similar or approximately equal (tested using Levene’s Test).
Levene’s Test
Levene’s Test is a statistical test used to check whether the variances (i.e., the spread or dispersion of scores) in the two groups are equal. Use the Welch’s t-test instead, which does not assume equal variances.
Hypotheses in Levene’s Test:
Null Hypothesis (H₀): The variances of the two groups are equal.
Alternative Hypothesis (H₁): The variances of the two groups are not equal.
How to interpret Levene’s Test result:
If p-value > 0.05 → Fail to reject H₀ → Equal variances can be assumed
If p-value ≤ 0.05 → Reject H₀ → Variances are significantly different → Use the Welch’s t-test instead, which does not assume equal variances
Example:
Suppose you’re comparing satisfaction scores between tourists visiting Kerala and Goa:
Run Levene’s Test in SPSS or any software.
If Levene’s Test p = 0.213, since this is greater than 0.05, you assume equal variances.
If Levene’s Test p = 0.001, this means the variances are unequal, and you must use the “Equal variances not assumed” row in your t-test output (Welch’s correction).
Applications across different domains
Let us explore how this test is used in real-world research across various disciplines.
1. Business: Testing the Impact of Sales Strategies
Scenario: A company implements two types of sales strategies—personal selling and digital marketing—and wants to compare their impact on sales performance.
- Group 1: 40 sales executives using personal selling
- Group 2: 40 executives using digital marketing
- Variable: Monthly sales figures
Analysis: The company uses an Independent Sample ‘t’ Test to check if there is a significant difference in mean sales performance. A statistically significant result would guide the company to choose the more effective strategy.
2. Education: Evaluating Online vs. Offline Learning
Scenario: An educational researcher wants to compare the academic performance of students who attended online classes versus those who attended offline classes.
- Group 1: 35 students (online learning)
- Group 2: 35 students (offline learning)
- Variable: Final semester exam scores
Analysis: An Independent Sample ‘t’ Test helps determine if one method of teaching is significantly more effective than the other based on mean test scores.
3. Healthcare: Assessing the Effectiveness of Two Medications
Scenario: A clinical trial is conducted to compare the effectiveness of two drugs in reducing blood pressure.
- Group 1: 50 patients on Drug A
- Group 2: 50 patients on Drug B
- Variable: Reduction in systolic blood pressure (mm Hg)
Analysis: The test will identify if there’s a significant difference in the average reduction in blood pressure between the two medications. This supports evidence-based medical decisions.
4. Economics: Evaluating Income Differences Between Two Regions
Scenario: An economist wants to compare average monthly income levels between urban and rural households in a particular state.
- Group 1: 60 urban households
- Group 2: 60 rural households
- Variable: Average monthly income (INR)
Analysis: The Independent Sample ‘t’ Test can reveal whether income disparities between the two regions are statistically significant. Policymakers can use such results to target welfare schemes.
5. Tourism: Comparing Tourist Satisfaction in Two Destinations
Scenario: A tourism board wants to compare international tourists’ satisfaction levels in two popular destinations (e.g., Kerala and Goa).
- Group 1: 45 tourists visiting Kerala
- Group 2: 45 tourists visiting Goa
- Variable: Satisfaction score (1 to 10 scale)
Analysis: If the test reveals a significant difference in average satisfaction, tourism authorities can identify the strengths or weaknesses of each destination and implement improvements accordingly.
Limitations
- Assumes normal distribution and equal variances
- Only compares two groups
- Sensitive to outliers in small samples
- For more than two groups, ANOVA is recommended
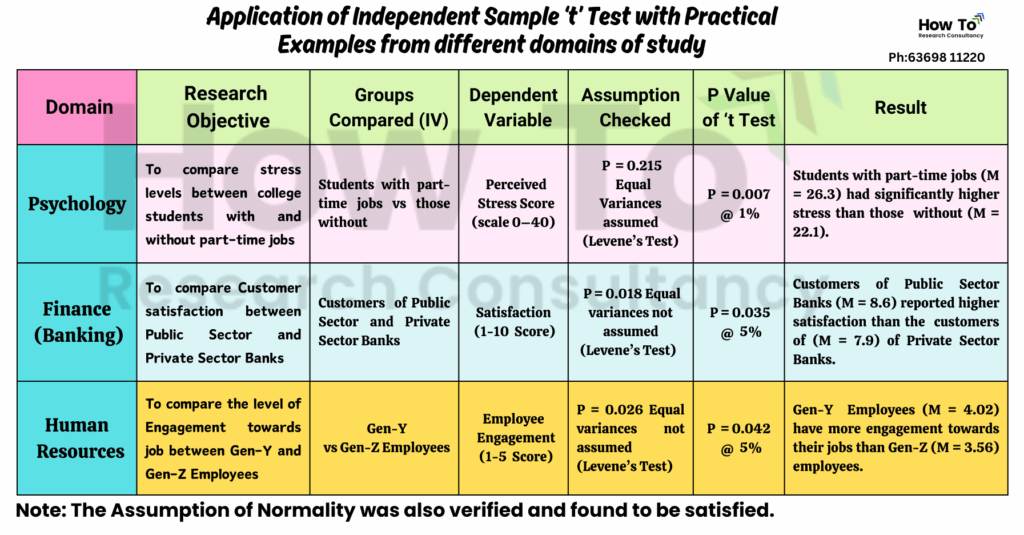
The following table demonstrates how the Independent Sample t Test is applied, including assumptions, variables, and interpretation using Levene’s Test and test results taking examples of Psychology, Finance (Banking) and HR domains of study.
Conclusion
The Independent Sample ‘t’ Test is an essential statistical method widely used in academic and professional research. Its ability to compare the means of two distinct groups allows researchers to draw meaningful inferences in fields like business, education, healthcare, economics, and tourism.
Understanding the assumptions and correct interpretation of results ensures that your findings are reliable and actionable. Whether it’s testing the impact of a new policy, marketing strategy, or service innovation—this test enables you to back decisions with data.
Do you need any assistance to apply the test? Contact us.


Leave a Reply