


If you are a student, researcher, or data analyst dealing with categorical data, the Chi-Square Test is a handy tool in your statistics toolbox. This test was introduced by Karl Pearson, a British mathematician and statistician, in 1900. He developed it as part of his work on statistical methods for biological and social sciences. The Chi-Square Test is a category of non-parametric test, meaning it does not assume a normal distribution of the data. It is used to see whether there is a significant relationship between two categorical variables. In this blog, we break down how to use the Chi-Square Test in research with simple steps and real-life examples from different fields like education, healthcare, marketing, and social science.
What is the Chi-Square Test?
The Chi-Square Test (χ² test) checks if there is a significant association between two categorical variables in a dataset. It compares the observed frequencies (what you actually see) with the expected frequencies (what you would expect if there were no relationship).
There are two main types:
- Chi-Square Test of Independence – Tests if two categorical variables are related.
- Chi-Square Goodness of Fit Test – Tests if a single categorical variable fits an expected distribution.
In this guide, we focus on the Chi-Square Test of Independence, which is the more commonly used version in research.
Chi-Square Test of Independence
When to Use It?
- You have categorical data (e.g., gender, product type, satisfaction level).
- You want to find out whether two variables are related.
- Your sample size is reasonably large (expected frequency in each cell should ideally be 5 or more).
Step-by-Step Guide to Using the Chi-Square Test
Step 1: Formulate Your Hypotheses
Null Hypothesis (H₀): There is no association between the variables.
Alternative Hypothesis (H₁): There is an association between the variables.
Example (Education):
Is there a relationship between a student’s major (Science, Arts, Commerce) and their preference for online or offline learning?
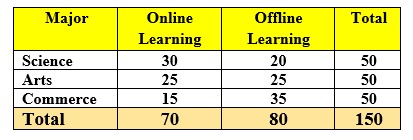
Step 2: Collect Data and Create a Contingency Table
Create a table showing how many observations fall into each combination of categories.
Take Major (Science, Arts and Commerce) in Rows and Online and Offline in Columns each.
Hence, three Rows and Two Columns for data and you can add additional column and Row for Total. Like in the following Observed Frequency table:
Step 3: Calculate Expected Frequencies
Use the formula:
Expected Frequency = (Row Total × Column Total) / Grand Total
For Science-Online cell:
(50 × 70) / 150 = 23.33
Repeat for all cells.
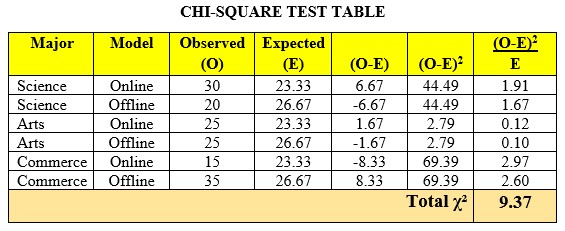
Step 4: Apply the Chi-Square Formula (through the table)
χ² = Σ [(O – E)² / E]
Where:
O = Observed frequency (the data we collected)
E = Expected frequency (the data we computed by applying the above formula in Step3)
Calculate this for each cell and then sum them all to get the total χ² value.
Step 5: Find the Degree of Freedom (df)
df = (rows − 1) × (columns − 1)
In our example:
Three Rows (Majors) and Two Columns (Learning Modes)
(3 – 1) × (2 – 1) = 2 df
Recap of Calculation Formulas
Expected Frequency (E) = (Row Total × Column Total) / Grand Total
(O − E) = Difference between Observed and Expected
(O − E)² = Square of the difference
(O − E)² / E = Contribution to Chi-Square statistic
Step 6: Determine the Critical Value or p-value
Use a Chi-Square distribution table or software (like SPSS, R, Excel, or online calculators) to get the critical value or p-value.
In case of using Statistical Table Value found in Statistics Text Book
Critical Value at α = 0.05 and df = 2 = 5.99 (Table Value)
Computed/Calculated Value = 9.37
If the Critical Value > Table Value, Reject the Null Hypothesis
Since χ² = 9.37 > 5.99, we reject the null hypothesis
Simply,
Reject H0 if CV is greater than TV
Accept H0 if CV is lesser than TV
Note: H0 = Null Hypothesis, CV = Computed Value and TV = Table Value.
In case of Software (SPSS, etc.) that is using “P” Value:
If the p-value < 0.05, Reject the Null Hypothesis – There is a significant association between the variables.
If the p-value > 0.05, Accept the Null Hypothesis – There is no significant association between the variables.
Note: P-Value = Probability Value which is given by Statistical Software like SPSS, etc.
Step 7: Interpret the Result
In this example, we reject the Null Hypothesis of “No significant Association” between variables.
Example Interpretation:
There is a statistically significant association between a student’s major and their preference for learning mode (online vs offline). This implies that the choice of online/offline learning may depend on what subject they are studying.
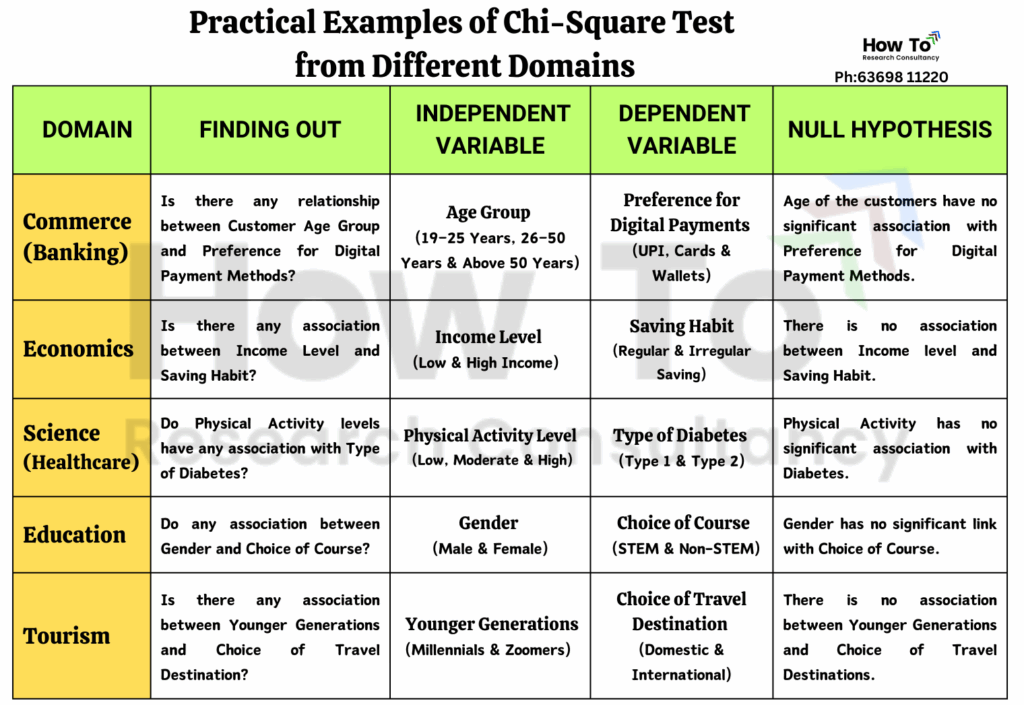
The following table presents the application of Chi-square test with respect to different domains of study:
General Tips for using the Chi-Square Test effectively
Following are the important tips and best practices to keep in mind when using the Chi-Square Test in research:
1. Type of Variables
Use categorical variables only (nominal or ordinal).
Examples: Gender (Male/Female), Mode of Learning (Online/Offline), Region (North/South).
Not suitable for continuous variables like income, age, test scores, etc.
2. Sample Size Requirements
Larger sample sizes (greater than 100) produce more reliable results.
Each expected cell frequency should be at least 5:
If more than 20% of expected cells are <5, results may not be valid.
If expected frequencies are too small, consider using Fisher’s Exact Test instead (especially in 2×2 tables).
3. Non-Parametric Test
The Chi-Square Test is Non-Parametric Test, meaning:
It does not assume a normal distribution or distribution-free test.
It is appropriate to use when the assumptions required for parametric tests (such as t-tests or ANOVA) are not satisfied. However, since it relies on fewer assumptions, it may provide less precise results compared to parametric tests.
4. Test of Association (Not Cause-and-Effect)
Chi-Square measures association or dependence, not correlation or causality.
You can say: “There is an association between gender and shopping preference.”
Do not say: “Gender causes shopping preference.”
5. Independence of Observations
Each case (respondent) should be counted only once.
Responses must be mutually exclusive and independent.
Example: A person choosing both Online and Offline modes would violate this.
6. Data Coding and Cleaning
Ensure variables are cleanly coded into categories (e.g., 1 = Male, 2 = Female).
Watch out for missing data and resolve ambiguities before running the test.
Conclusion
The Chi-Square Test is a powerful yet simple tool for exploring relationships in categorical data. Whether you’re researching students’ preferences, customer behaviour, or healthcare patterns, this test can help you draw meaningful conclusions based on real evidence.
Use it wisely and always remember: numbers tell stories — the Chi-Square Test helps you listen! Contact us for any difficulty in using this test.


Leave a Reply