


If you’re doing research and dealing with comparing more than two groups, you’ve probably come across the term ANOVA. In the world of research, whether you’re in education, business, psychology, or healthcare, you’ll often come across situations where you need to compare the average outcomes of multiple groups. That’s where ANOVA (Analysis of Variance) becomes your go-to tool. It helps you determine whether the differences in the group means are real or just due to random chance.
In this blog, let’s break down what ANOVA is, when and how to use it, and most importantly, how it works in real-world research scenarios—whether you’re studying education, business, healthcare, or even psychology.
What is ANOVA?
ANOVA stands for Analysis of Variance. It’s a statistical method used when you want to compare the means of three or more groups to see if at least one of them is significantly different.
Think of it like this: you’re a teacher, and you want to know whether students from three different teaching methods scored differently on a test. You can’t use t-tests multiple times, or you’ll increase the chance of making a wrong conclusion. That’s where ANOVA comes in!
When should you use ANOVA?
Use ANOVA when:
- You have one independent variable (called a factor) with three or more groups (or levels).
- Your dependent variable is numerical (e.g., test score, income, weight).
- You want to check if group means are significantly different.
Steps to Conduct ANOVA (One-Way ANOVA)
Step 1: Define Your Hypotheses
- Null Hypothesis (H₀): All group means are equal.
- Alternative Hypothesis (H₁): At least one group mean is different.
Step 2: Collect and Organize Data
Let’s explore examples in different fields:
Example 1: Education
You test the academic performance of students under three teaching styles:
- Group A: Traditional classroom
- Group B: Online learning
- Group C: Hybrid mode
The test scores are your dependent variable, and the teaching method is the independent variable.
Example 2: Business
You want to check whether three different types of digital ads affect customer engagement differently:
- Group A: Instagram ads
- Group B: Email marketing
- Group C: YouTube ads
Customer Engagement is the Dependent Variable and the Types of Digital Ads is Independent Variable with three options/groups.
Example 3: Economics
You want to examine whether different types of soil affect the crop yield for farmers in a particular region.
- Group A: Sandy Soil
- Group B: Loamy Soil
- Group C: Clay Soil
Crop Yield is the Dependent Variable and the Types of Soils is Independent Variable with three options/groups.
Step 3: Use Software to run ANOVA
You can perform ANOVA using various software tools such as SPSS, Excel, R, Python, Jamovi, and JASP. These tools help you analyze group differences efficiently and interpret the results with ease.
Step 4: Check the Output
Key terms you’ll see:
F-value: The test statistic. Higher = more likely group means are different.
p-value: If p < 0.05, reject the null hypothesis. That means at least one group is different!
Step 5: Post Hoc Tests (If needed)
ANOVA tells you there’s a difference, but not where it is. So, use a Post Hoc test (like Tukey’s HSD) to find out which groups differ.
Example: If the p-value is significant in the teaching method example, a post hoc test may show that hybrid learning is better than traditional, but not significantly different from online.
Assumptions to Check Before Running ANOVA
- Independence of observations
- Normality of the data (use histogram or Shapiro-Wilk test)
- Homogeneity of variances (check using Levene’s test)
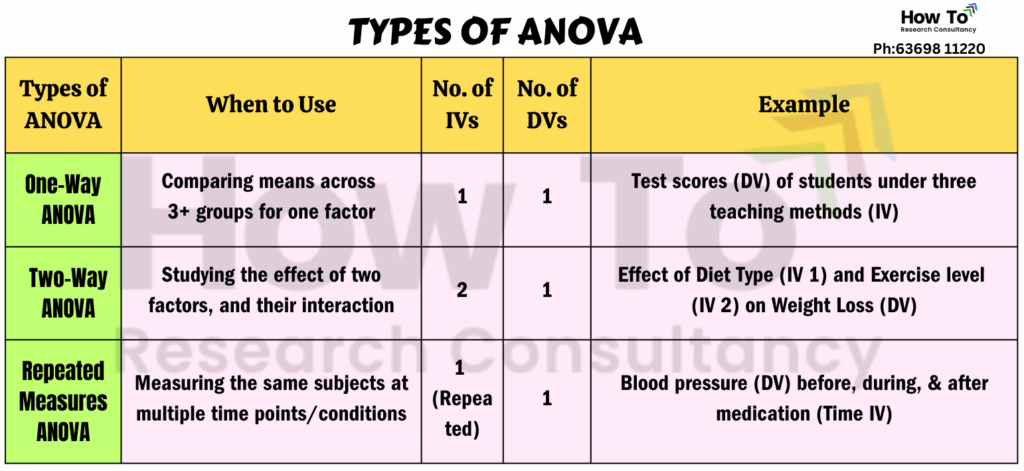
Types of ANOVA (Explained Simply)
Depending on your research design and the number of variables, ANOVA comes in different types. Here are the most commonly used ones:
1. One-Way ANOVA
This is the most basic type of ANOVA. It’s used when you’re comparing three or more groups based on a single independent variable (factor).
Purpose: To check whether the mean differences among the groups are statistically significant.
Example: Suppose you’re studying the effectiveness of different teaching methods. You divide students into three groups: traditional, online, and hybrid.
One-Way ANOVA helps you check if at least one method leads to better performance compared to the others.
2. Two-Way ANOVA
Two-Way ANOVA is used when you have two independent variables, and you want to examine their individual effects and interaction effect on a single dependent variable.
Purpose: To see not only how each factor affects the outcome, but also whether they work together to produce different results.
Example: Let’s say you’re researching how diet type (Keto, Vegan, Mediterranean) and exercise frequency (None, Moderate, High) affect weight loss.
Two-Way ANOVA helps determine:
- Whether diet type affects weight loss
- Whether exercise level affects weight loss
- Whether the combination of both (Interaction effect) creates a stronger effect
This type of ANOVA gives you more insight into complex relationships in your data.
Interaction Effect
The key to detecting an interaction effect is the Interaction term in the ANOVA table. This is usually represented as the combination of your two independent variables (e.g., Diet × Exercise). The interaction effect will show if the effect of one factor depends on the level of the other factor.
You don’t need to manually multiply or create new variables for each combination (like Keto × None, Keto × Moderate, etc.). The software does this automatically as part of the Two-Way ANOVA process.
Examples of Interaction Effect
- Healthcare (Diet × Exercise → Weight loss)
- Education (Teaching Method × Study Time → Exam Scores)
- Marketing (Ad Type × Platform → Customer Engagement)
If the p-value for the interaction term is less than your significance level (usually 0.05), this indicates a significant interaction effect between the two factors (Diet and Exercise). A significant interaction means that the effect of one independent variable (like diet type) on the dependent variable (weight loss) differs depending on the level of the other independent variable (exercise frequency). It indicates that the combination of Diet and Exercise has a significant impact on weight loss.
3. Repeated Measures ANOVA
This type is used when the same participants (subjects) are measured multiple times under different conditions or across different time periods.
Purpose: To examine changes within subjects rather than between different groups. To determine whether there are significant differences within subjects across time or conditions.
Example: You track a group of patients’ blood pressure before, during, and after a new treatment (For example: Week 1, Week 4, Week 8 separately for each time point).
Within-subjects factor = Time (Week 1, Week 4, Week 8)
Dependent variable = Weight Loss (measured at multiple time points)
Between-subjects factor (optional) = Diet type
Since it’s the same people being tested repeatedly, Repeated Measures ANOVA helps account for that and detects meaningful changes over time. It tells you if weight loss changed significantly over time. It also tells if the change over time depends on the diet type (i.e., interaction effect). Think of it as a way to track progress or patterns within a single group.
Each type of ANOVA has a unique use case, and the right choice depends on:
- The number of groups and variables,
- Whether you’re measuring once or repeatedly
Check out the summary table below for a clear and simple comparison of the different types of ANOVA, making it easier to understand which one suits your research needs.
Final Thoughts
ANOVA is a powerful tool to compare groups and make decisions backed by data. Whether you’re a researcher in Psychology, Marketing, Medicine, or Education—if you’re comparing three or more groups, ANOVA is your go-to test.
Got questions or want help with your data? Drop a comment below or reach out—happy analysing!


Leave a Reply