


Introduction
Hypothesis testing is a crucial aspect of research that allows scholars and professionals to make data-driven decisions. It is a statistical method used to determine whether there is enough evidence in a sample data set to infer a conclusion about a population. The process of hypothesis testing helps in validating theories, making business decisions, and solving real-world problems based on empirical evidence.
Steps in Hypothesis Testing
The process of hypothesis testing generally follows these key steps:
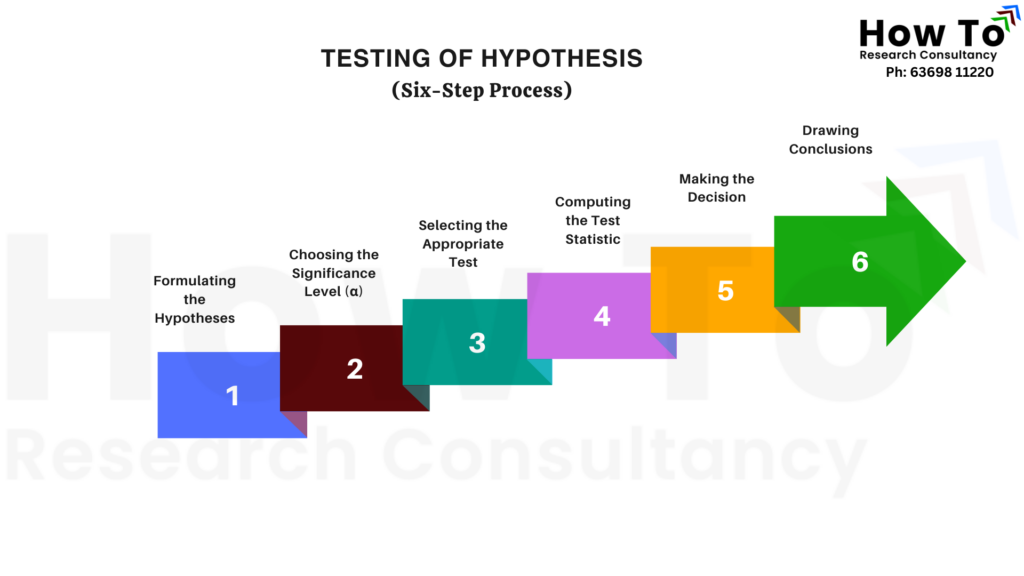
1. Formulating the Hypotheses:
The first step is to define the null hypothesis (H₀) and the alternative hypothesis (H₁). The null hypothesis represents a statement of no effect or no difference, while the alternative hypothesis represents the claim to be tested.
2. Choosing the Significance Level (α):
The significance level, usually set at 0.05 (5%), determines the probability of rejecting the null hypothesis when it is actually true.
3. Selecting the Appropriate Test:
Depending on the type of data and study, various statistical tests like t-tests, correlation tests, ANOVA, or regression analysis are chosen.
4. Computing the Test Statistic:
Based on the sample data, a test statistic is calculated to compare against a critical value.
5. Making the Decision:
If the test statistic falls in the rejection region, the null hypothesis is rejected in favour of the alternative hypothesis.
6. Drawing Conclusions:
Based on the results, the researcher interprets the findings and provides practical implications.
Practical Examples
Example 1: Hypothesis Testing in Business
A retail store wants to test whether giving Promotional Offers (Discounts, Free, etc.) increases customers for particular Brand Cosmetics. The hypotheses are:
H₀: Promotional Offers do not significantly increase customer visits.
H₁: Promotional Offers lead to a significant increase in customer visits.
The store collects sales data for two months—one with Promotional Offers and one without. A t-test is conducted to compare average sales of particular Brand Cosmetics in both months. If the p-value is less than 0.05, the store concludes that Promotional Offers do impact customer visits for particular Brand Cosmetics.
Example 2: Hypothesis Testing in Healthcare
A pharmaceutical company tests a new drug’s effectiveness in reducing blood pressure. The hypotheses are:
H₀: The new drug has no effect on blood pressure.
H₁: The new drug significantly reduces blood pressure.
A clinical trial is conducted with two groups: one receiving the new drug and another receiving a placebo. If the statistical analysis shows a significant reduction in blood pressure in the treatment group compared to the placebo group, the company can claim the drug’s effectiveness.
Example 3: Hypothesis Testing in Human Resource Management (HRM)
A company wants to analyse whether employee training programs significantly improve job performance. The hypotheses are:
H₀: Employee training programs have no significant impact on job performance.
H₁: Employee training programs significantly improve job performance.
The company collects performance ratings of employees before and after a structured training program. A Paired t-test is conducted to compare the mean performance scores before and after training. If the p-value is less than 0.05, the company concludes that the training program has a significant positive effect on employee performance.
Example 4: Hypothesis Testing in Tourism
A tourism board wants to investigate whether Tourist satisfaction in hotels influences their intention to revisit a destination. The hypotheses are:
H₀: Tourist satisfaction in hotels has no significant impact on revisit intention.
H₁: Tourist satisfaction in hotels significantly influences revisit intention.
The board collects survey responses from tourists about their hotel experiences and their likelihood of returning to the destination. A Regression Analysis is conducted to examine the relationship between satisfaction scores and revisit intention of Tourists. If the p-value is less than 0.05, the study concludes that hotel satisfaction significantly impacts tourists’ decision to return.
Example 5: Hypothesis Testing in Economics (Primary Data)
An economist wants to examine whether household income is correlated with savings rate. The hypotheses are:
H₀: There is no significant correlation between household income and savings rate.
H₁: There is a significant correlation between household income and savings rate.
The economist collects data from 500 households, measuring their monthly income and percentage of income saved. A Pearson Correlation Analysis is performed to determine the strength and direction of the relationship between the two variables.
If the correlation coefficient (r) is close to 1 (positive correlation), higher-income households tend to save more. If r is close to -1 (negative correlation), higher-income households save less. If r is close to 0 and the p-value > 0.05, no significant correlation exists. If the p-value is less than 0.05, the economist concludes that income level significantly influences the savings rate, aiding financial policy decisions.
Example 6: Hypothesis Testing in Economics (Secondary Data)
An economist wants to examine whether GDP growth is correlated with the inflation rate in a country. The hypotheses are:
H₀: There is no significant correlation between GDP growth and the inflation rate.
H₁: There is a significant correlation between GDP growth and the inflation rate.
The economist collects annual GDP growth rates and inflation rates from the past 25 years. A Pearson correlation analysis is conducted to assess the relationship between these two economic indicators.
If the correlation coefficient (r) is positive and close to 1, it indicates that higher GDP growth is associated with rising inflation. If r is negative and close to -1, it suggests that as GDP growth increases, inflation tends to decrease (which may indicate strong monetary policies or productivity-driven growth). If r is close to 0 and the p-value > 0.05, it means there is no significant correlation between GDP growth and inflation. If the p-value is less than 0.05, the economist concludes that GDP growth significantly influences inflation, which can guide monetary and fiscal policy decisions.
Conclusion
Hypothesis testing is a powerful statistical tool used across various disciplines. By following a systematic approach, researchers can make informed decisions backed by empirical data. Whether in business, healthcare, or academia, understanding hypothesis testing enables better problem-solving and strategic decision-making.
Do you need help in formulating and testing hypotheses? Get expert guidance to ensure accurate and data-driven research results—reach out today!


Leave a Reply